As a user,
When I navigate to the Analyze tab,
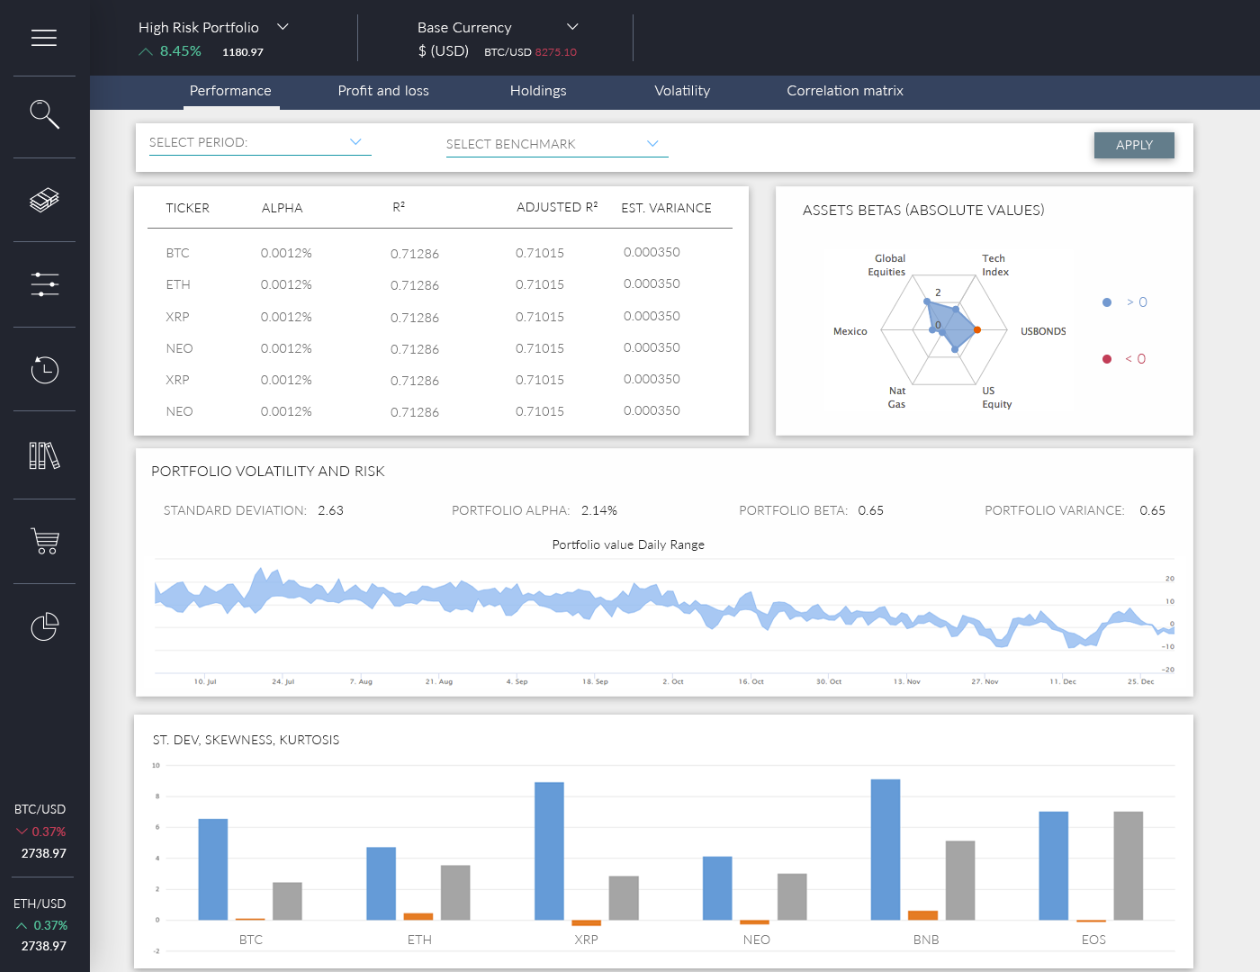
I should see what is the standard deviation of my portfolio. For that purpose we need two selectors with two options each (currently on top of the page, where they should remain):
- period (30 days, 60 days)
- benchmark (BTC price, ETH price)
- base currency (ETH, USD)
Standard deviation of the portfolio is calculated as follows:
- Calculate the average (mean) price for the number of periods or observations - 30 days or 60 days.
- Determine each period's deviation (close price less average price).
- Square each period's deviation.
- Sum the squared deviations.
- Divide this sum by the number of observations.
- The standard deviation is then equal to the square root of that number.
http://mathjs.org/docs/reference/functions/std.html
As a user,
When I navigate to the Analyze tab,
I should see what is the standard deviation of my portfolio. For that purpose we need two selectors with two options each (currently on top of the page, where they should remain):
Standard deviation of the portfolio is calculated as follows:
http://mathjs.org/docs/reference/functions/std.html